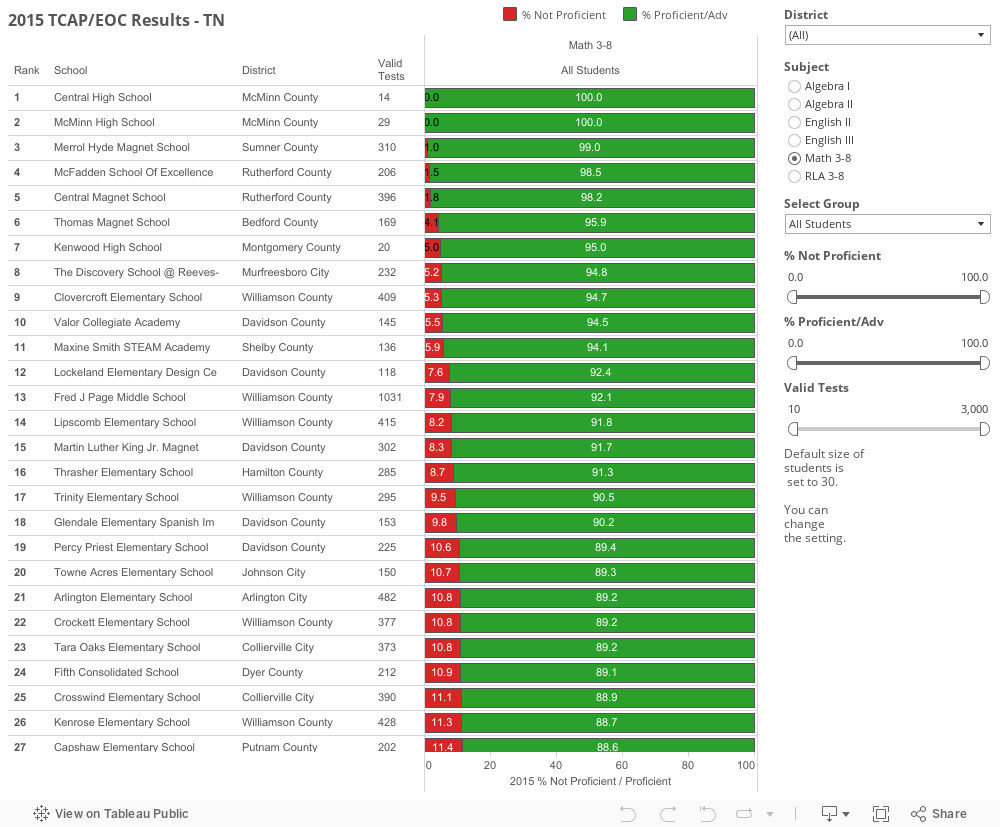
TN State Testing Dashboard 2015
View how TN schools compare to each other using proficiency rates from 2015 state test data. This dashboard defaults to all students, however you can change the student population to view the achievement data differently. Be sure to change the subgroup to analyze how other groups are performing. Subgroups within schools are important to school accountability.
Extend your comparison by changing the student cohort size to understand how schools with similar enrollments performed compared to your school.
Example: Set the "Groups" filter to Economically Disadvantaged AND change the Valid Test to show schools from 400 to 3000. The comparison will change to only rank schools that meet the requested criteria.