
Student Grades
tudent grades captured by a student information system (SIS) are a valuable source of information for monitoring and improving student performance. It is important to analyze grade data frequently to identify trends and patterns in student performance, as it can provide insights into student understanding of course material and overall academic progress.
Through the use of an SIS, schools and districts can capture and archive student grade data, providing a rich source of information for analysis. By monitoring student grades, educators can identify students who may be struggling academically and intervene early to provide additional support. This can help to prevent students from falling behind and increase the likelihood of success.
Furthermore, analyzing grade data can help identify areas where teachers may need additional support or professional development. For example, if a large number of students are performing poorly in a particular subject or course, it may indicate that the curriculum or instruction needs to be adjusted.
In addition to identifying areas for improvement, analyzing grade data can also provide valuable insights into student achievement over time. By tracking changes in student grades from one semester or school year to the next, educators can determine if their intervention strategies are effective and make necessary adjustments to improve student outcomes.
Overall, the analysis of student grades captured by an SIS is a critical component of the continuous improvement process in education. It provides a wealth of information that can inform decisions related to student support, instructional practices, and overall school or district improvement efforts.
Our work in this area has led to a number of improvements in grade management:
Identification of high failing courses by teacher well before final grades are posted
Ongoing data cleanup by pinpointing missing grades in the SIS
A better understanding of cohort performance in every course
Analysis of correlations between classroom student grade performance and standardized tests
Auditing of senior graduation requirements using current and historical grades
Pinpoint Struggling Students
Student grade dashboards enable practitioners to quickly identify courses where high percentages of students are failing by using intuitive controls similar to those used in online airline ticket purchases. These dashboards are essential for timely intervention and providing targeted support to struggling students and teachers. By identifying struggling courses early, educators can use data-informed decision-making to develop effective strategies for improving academic outcomes. This can lead to improved student engagement, increased retention rates, and higher achievement levels for all students.
Example:
Changing a slider to show courses where a percentage (30%) of the students or higher are earning D's or F's:


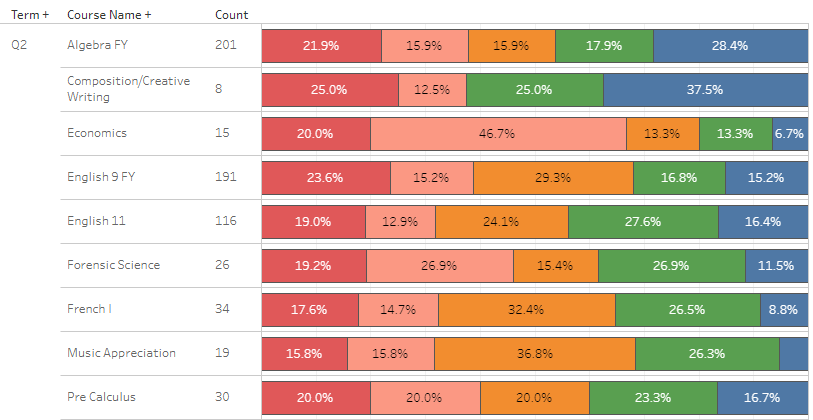
Takeaways from this data example:
21.9% of the students earning F, 15.9% earning D, 28.4% earning A in Algebra FY (37.8% failing will cause students to retake course)
31.9% of students are failing English 11, a required course for graduation
66.7% of Economics students earning D or F
In K12 education, auditing student grades can be challenging due to the presentation of grading distribution data in an aggregate format. Without access to underlying student data, analyzing trends across students, courses, or teachers becomes difficult. Our student grade dashboards provide the necessary tools to address these challenges and improve the utilization of grading data. These dashboards allow for easy identification of struggling courses and students, which is crucial for providing targeted support and interventions. With our dashboard design, practitioners can quickly and accurately analyze grading data and identify trends in student performance, helping to improve overall academic outcomes.
Cohort Analysis
Our dashboards have been developed to allow for the analysis of student cohorts in specific courses, in comparison to their overall academic performance. This allows educators to identify courses in which a significant percentage of students are struggling, compared to their performance in other courses. It is not uncommon to find courses in which a large proportion of students are underperforming, despite doing well in other courses. Our dashboard system enables educators to identify these trends early on, and implement targeted interventions to support struggling students.
Historical Grades
The federal government mandates districts to store student grades in their SIS. However, this data is often not readily available to school leaders in a format that can be easily analyzed. Our dashboard system design includes a process that extracts all historical grades as far back as your system allows. We have successfully extracted up to 21 years of student grade data to ensure all of the various types of students enrolled in the district have historical data available.
Why is it important to have access to such an extensive amount of historical data? Historical grades are integrated into a student's profile. When analyzing grades for a current term and viewing a student's record, all historical data becomes available with one additional click. This allows a practitioner to review a student's grade performance over multiple years of instruction. For instance, a student that struggles in Algebra I may have had difficulties in mathematics since grade 1. Without a comprehensive dashboard system, it would be impossible to review and analyze these types of data patterns.